

China's Rubber Processing Machine Export Analysis
Distribution of China’s Rubber & Plastic Processing Machines Export Enterprises
| No. | Districts | Volume(Units) | Value(USD) | Y-o-Y | |
| Volume | Value | ||||
| 1 | Jiangsu | 20,919 | 266,106,542 | -7.70% | 25.80% |
| 2 | Guangdong | 41,297 | 176,704,159 | 25.70% | 4.60% |
| 3 | Shandong | 5,104 | 152,344,503 | -11.20% | -16% |
| 4 | Zhejiang | 24,652 | 113,731,339 | -59.90% | 11.10% |
| 5 | Shanghai | 19,776 | 93,829,900 | 133.90% | 1% |
| 6 | Liaoning | 792 | 49,116,299 | -16% | 13.30% |
| 7 | Beijing | 397 | 33,252,971 | -12% | 84.70% |
| 8 | Hunan | 153 | 30,991,286 | -39.30% | 7.80% |
| 9 | Fujian | 2,584 | 28,213,089 | -46.70% | 6.90% |
| 10 | Guangxi | 125 | 24,787,931 | -15.50% | 31.60% |
From January to December in 2015, Jiangsu, Guangdong and Shandong were China’s main export origins of rubber & plastic machines. Their export value of the articles accounted for 58.5% of China’s total.
Major Markets for China’s Rubber & Plastic Processing Machines Export
| No. | Country | Volume(Units) | Value(USD) | Y-o-Y | |
| Volume | Value | ||||
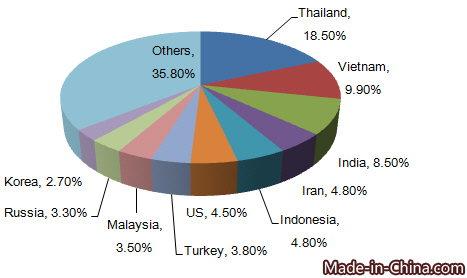
| 1 | Thailand | 3,663 | 188,332,033 | 12.70% | 46.50% |
| 2 | Vietnam | 5,657 | 100,422,514 | -14.50% | 29.60% |
| 3 | India | 4,445 | 86,445,034 | -37.80% | -8.20% |
| 4 | Iran | 15,869 | 48,576,551 | 15.90% | 13.40% |
| 5 | Indonesia | 4,715 | 48,472,648 | -27.60% | -10.80% |
| 6 | United States | 22,642 | 45,980,884 | 589.70% | 47.90% |
| 7 | Turkey | 2,270 | 38,973,865 | 6.30% | 36% |
| 8 | Malaysia | 5,946 | 35,793,753 | 42.80% | 7.50% |
| 9 | Russian Federation | 2,483 | 33,414,299 | -18.70% | 13.90% |
| 10 | Korea | 4,785 | 27,027,297 | 2.10% | 10.30% |

From January to December in 2015, major markets for China’s rubber & plastic processing machines exports included Thailand, Vietnam, India, Iran, Indonesia, the United States, Turkey, Malaysia, Russian Federation, Korea etc. Thailand was the largest market for China. In 2015, China’s export value of this article accounted for 18.5% of total.
Rubber & Plastic Processing Machines Importing Countries
| Country | Import Value(USD) | Y-o-Y |
| China | 619,966,000 | -48.00% |
| United States | 365,500,000 | 14.00% |
| Germany | 246,516,000 | 0.30% |
| India | 238,104,000 | 14.40% |
| Mexico | 213,252,000 | 16.10% |
From January to December in 2015, China, the United States, Germany, India and Mexico were top 5 rubber & plastic processing machines importing countries. China was the largest import country and the import values was USD 620,000,000, falling by 48% on year.
Rubber & Plastic Processing Machines Exporting Countries
| Region/Country | Export Value(USD) | Y-o-Y |
| Germany | 1,413,984,000 | -26.30% |
| China | 1,018,716,000 | 6.50% |
| Italy | 688,061,000 | 2.70% |
| Taiwan | 322,403,000 | -13.00% |
| United States | 315,757,000 | 8.20% |
From January to December in 2015, rubber & plastic processing machines exporting regions included Germany, China, Italy, Taiwan and the United States. Germany was the largest exporting country and the export value was USD 1,414,000,000.


